A map and data panels with birds and turtles in the background, representing GIS maps of animal populations.

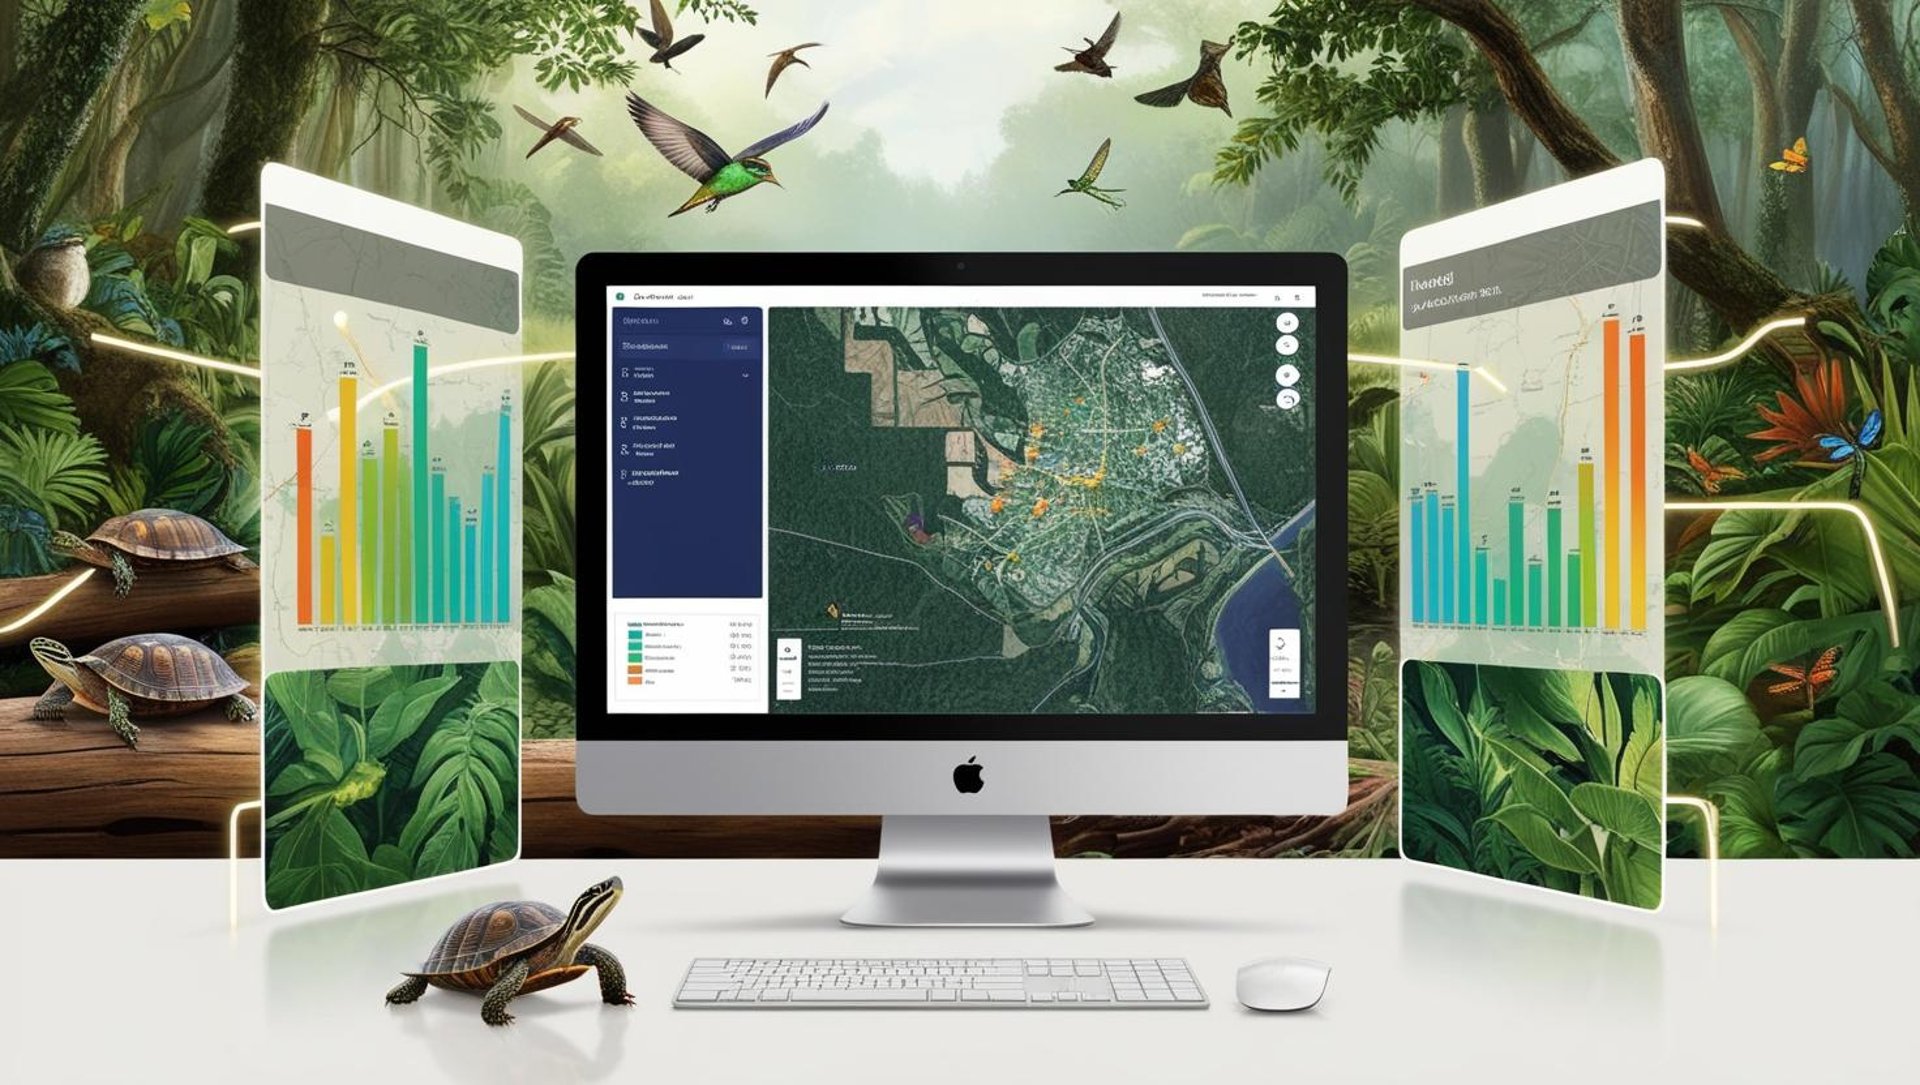
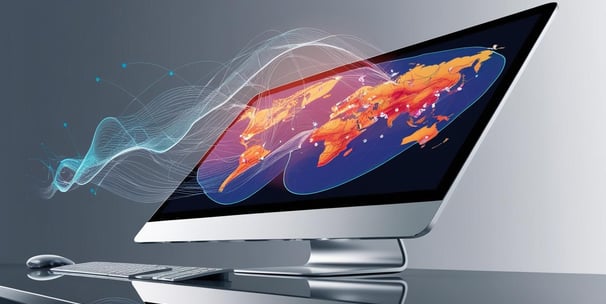
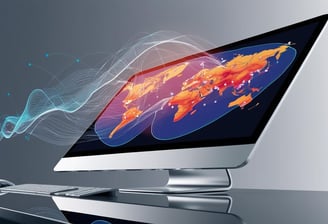
GEOSPATIAL SOLUTIONS: Every Industry Can Benefit from Data Visualization and Geospatial Analysis

blue and white striped round textile

Urban planning. Environmental management. Disaster response. From forestry health evaluation to creating flood prediction maps, or from identifying potential sink holes to estimating land surface temperatures, Geospatial Solutions have wide applications in a tapestry of industries across the globe.

Click here for a more comprehensive list of MGeoS services.

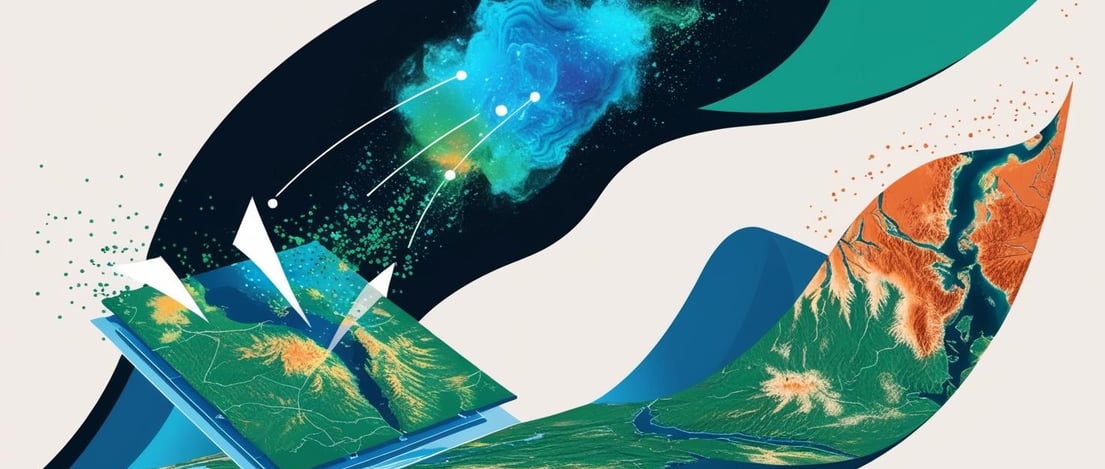
Mapping the Future One Solution at a Time

McBean Geospatial Solutions can help you unlock insights and optimize decisions through innovative mapping and visualization, training, and analysis. Transform the world with geospatial precision.

Abstract image representing satellite data entering a computer and producing a map.
A map on a center monitor with two panels beside it, showing data.

Geospatial Intelligence, Leadership and Innovation

MGeoS can help you visualize data to enhance your decision-making processes.

MGeoS can provide relevant GIS training for your team.

MGeoS can conduct In-depth analysis of spatial and satellite data for informed strategic planning.

Geospatial Solutions

Visualize. Optimize. Transform.

An instructor points to a map on a monitor, teaching a group of business people.
An artistic image of data streaming into a monitor which shows a map.
Optimize Decisions

Enhance your skills with bespoke training programs designed for your geospatial mapping and analysis needs.

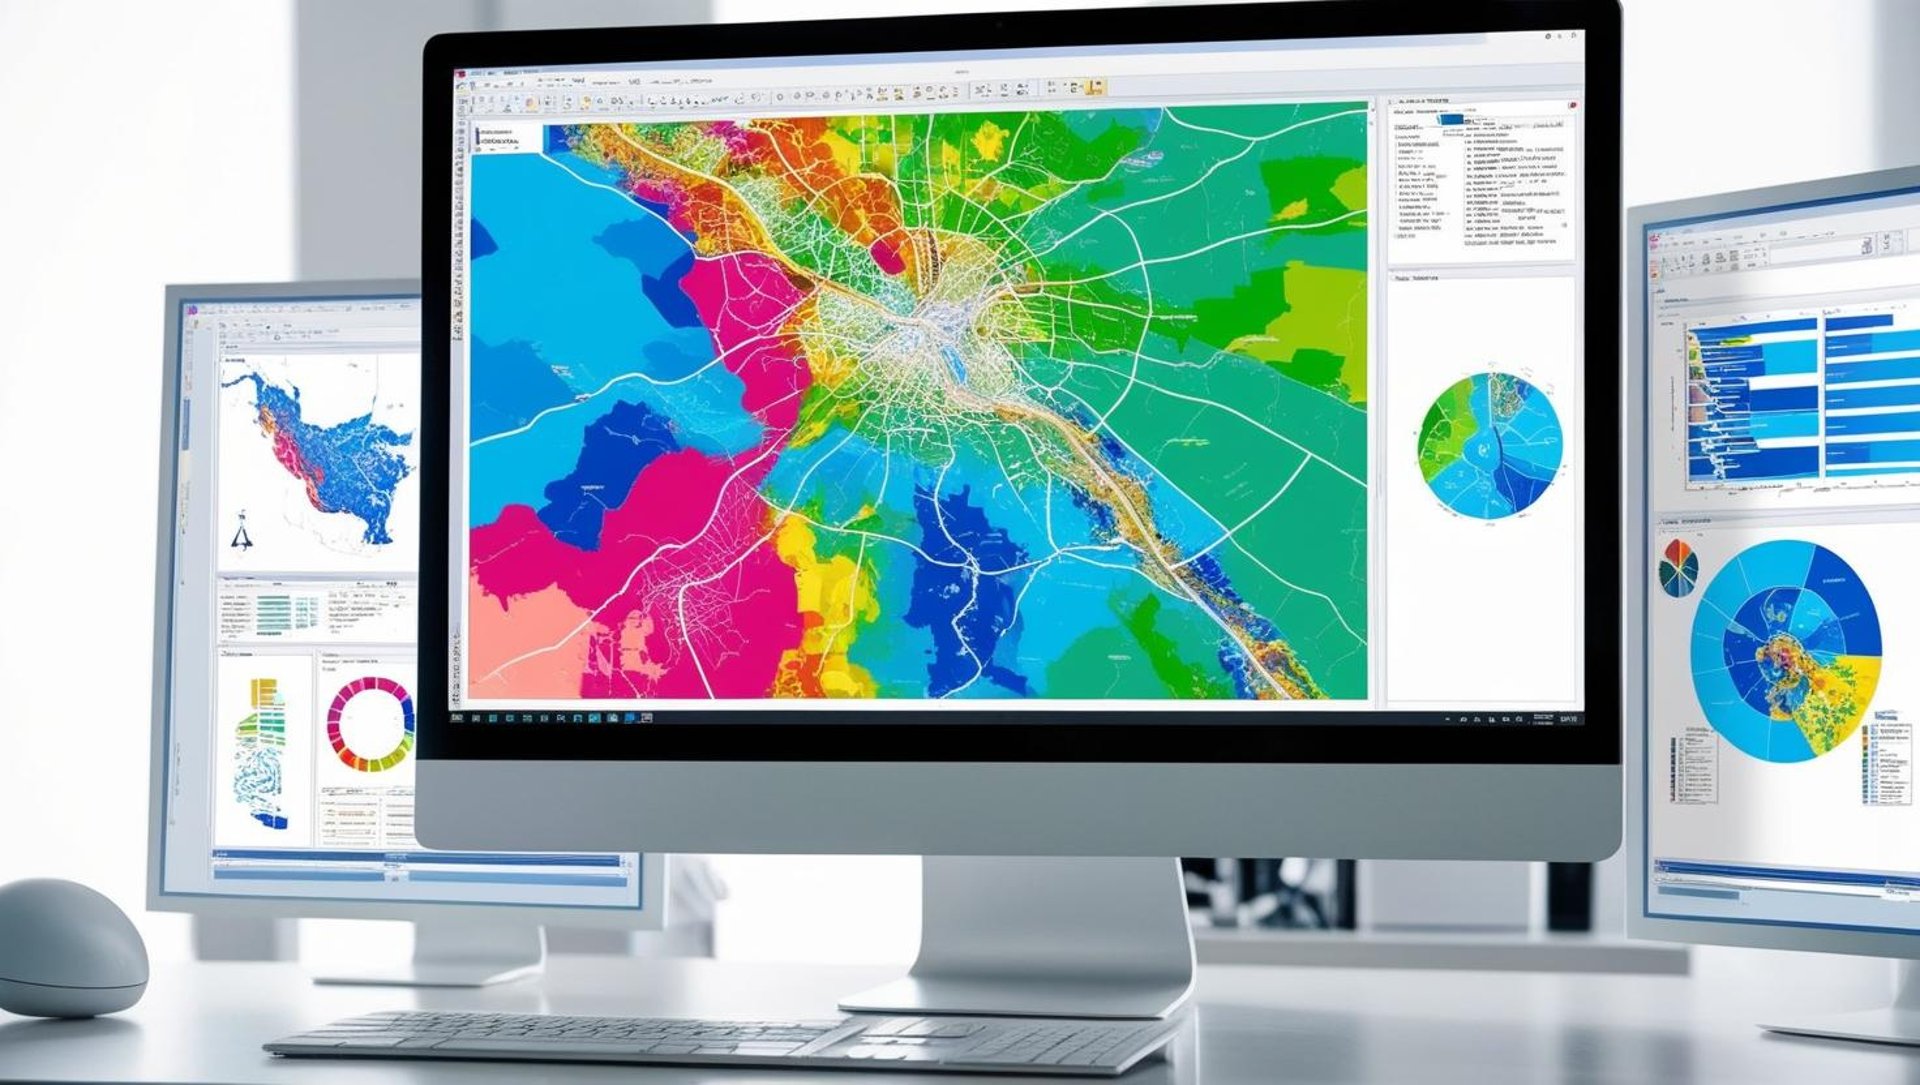
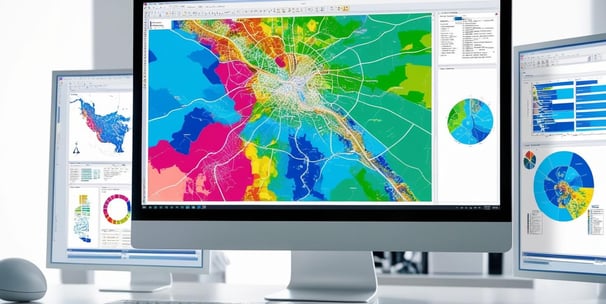
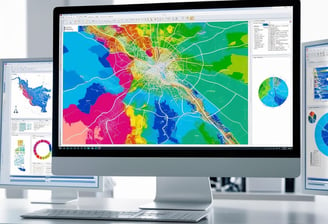
Unlock Insights through Visualization

Transform your data into actionable insights through clear analysis and visualization techniques.

A map on a center monitor with two panels beside it, showing data.
Transform the World

Distill large and complex datasets into meaningful maps to enhance strategic planning and problem solving.
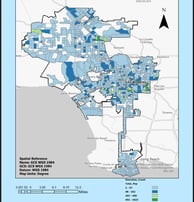
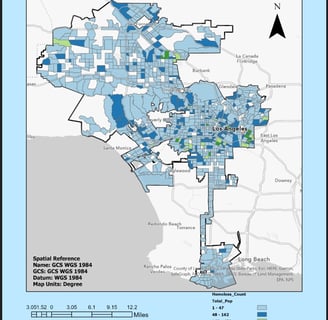
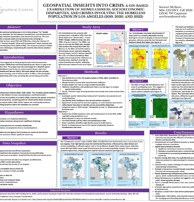
Photo of a man in front of two monitors with GEOINT maps displaying data on poverty and protests.

Gallery

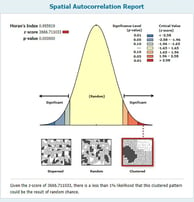
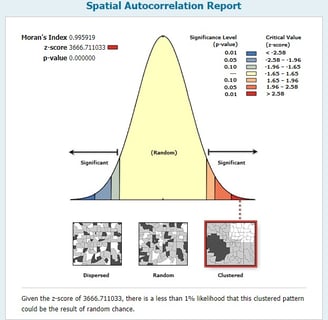
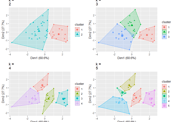
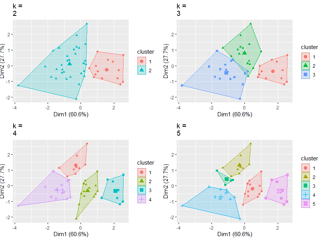
A sample of MGeoS's innovative geospatial solutions and transformative mapping projects.

A GEOINT project poster on Political Movements in Africa using ArcGIS Pro.
A bell curve of analyzed data showing significant levels, critical values and Moran's Index results.
Mapped data of clustered points.
A spatial reference ArcGIS map showing data from 2022 of LA's Homeless Count.
A Geographical Sciences capstone poster called Geospatial Insights into Crisis about homelessness in LA, 2022. using ArcGIS.
MGeoS logo on white background.